


In many physical environments, understanding how people actually move, interact, and spend time has always been more difficult than tracking what they buy. Ticket scans, access logs, and point-of-sale data offer fragments of information, but they rarely show the full picture. RFID wristbands change that. By quietly collecting location and interaction data as customers move through a space, RFID wristbands make the customer journey visible in ways that were previously impossible.
From theme parks and resorts to exhibitions, sports venues, hospitals, and cashless events, RFID wristbands are becoming a practical tool for visualizing real-world behavior. This article explores how RFID wristbands enable customer journey visualization, what types of data they generate, how that data is interpreted, and what organizations should consider before deploying them.
What “Customer Journey Visualization” Means in Physical Spaces
In digital environments, customer journeys are easy to map. Clicks, page views, session times, and conversions are recorded automatically. Physical spaces, however, have always relied on assumptions.
Moving Beyond Entry and Exit Data
Traditional systems usually record only when a person enters or leaves a location. A turnstile scan or ticket validation confirms presence, but everything that happens in between is invisible. RFID wristbands fill this gap by registering interactions throughout the visit.
Each interaction — passing a reader, tapping at a kiosk, entering a restricted zone — becomes a data point. When these data points are combined, they form a timeline that reflects how customers actually move through a space.
From Isolated Events to Continuous Paths
Instead of isolated timestamps, RFID wristbands allow operators to see continuous paths. For example, rather than knowing that a guest entered at 10:03 and exited at 16:40, operators can see which areas they visited first, where they spent the most time, and which experiences they skipped entirely.
This shift from static records to dynamic paths is what makes visualization possible.
How RFID Wristbands Capture Movement and Interaction Data
RFID wristbands are simple on the surface, but the system behind them is carefully designed to balance data accuracy, comfort, and operational reliability.
Passive vs. Active RFID Wristbands
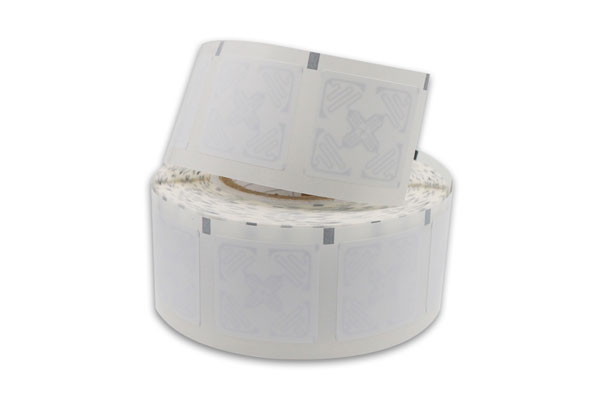
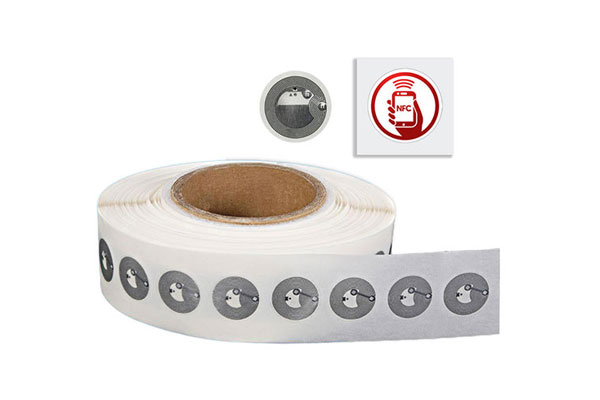
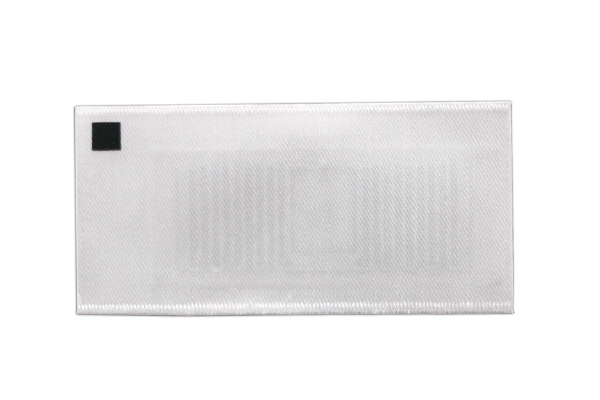
Most customer journey applications rely on passive RFID wristbands, especially HF (13.56 MHz) or UHF variants. Passive wristbands do not contain batteries; they are powered by the reader’s signal. This makes them lightweight, low-cost, and suitable for large-scale deployments.
Active RFID wristbands, which include batteries and broadcast signals periodically, are used in specialized environments where long-range or real-time location tracking is required. However, they introduce higher costs and more complex maintenance.
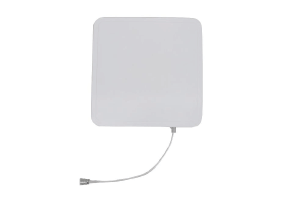
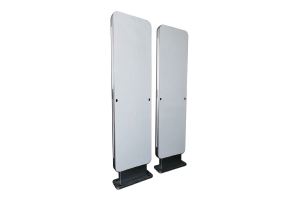
Fixed Readers, Gateways, and Interaction Points
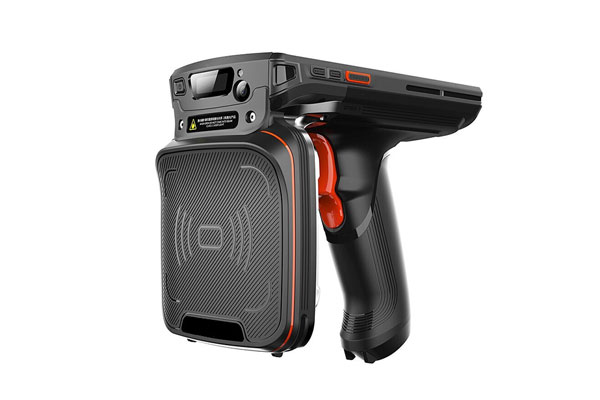
Visualization depends on reader placement. Fixed readers at entrances, zone boundaries, kiosks, and activity stations define the structure of the journey. Each read event includes the wristband ID, location, and timestamp.
The system does not track people continuously like GPS. Instead, it records meaningful moments — when a guest enters a zone, interacts with a service, or completes an activity. This approach reduces data noise while preserving useful insights.
Turning Raw RFID Reads into Visual Customer Journeys
Collecting data is only the first step. Visualization requires interpretation.
Mapping Physical Spaces into Digital Zones
Before any wristbands are issued, the physical environment is mapped into logical zones. These might include entrances, attractions, dining areas, rest zones, or service points. Each reader corresponds to a zone in the system.
When a wristband is detected, the system assigns that interaction to a zone. Over time, a sequence of zones forms a journey map for each visitor.
Time, Frequency, and Flow Analysis
Three dimensions dominate RFID-based journey visualization:
· Time: How long visitors stay in each zone
· Frequency: How often they return to the same area
· Flow: The order in which zones are visited
These dimensions reveal patterns that are difficult to see through observation alone. For example, a visually popular area might actually have short dwell times, indicating congestion rather than engagement.

Practical Use Cases Across Different Industries
RFID wristband–based journey visualization is not limited to a single industry. Its value emerges differently depending on the environment.
Theme Parks and Attractions
In theme parks, RFID wristbands help operators understand crowd movement throughout the day. By visualizing guest flows, parks can adjust staffing, modify queue layouts, or reschedule performances to reduce bottlenecks.
More importantly, long-term data reveals how first-time visitors differ from repeat guests, enabling better experience design.
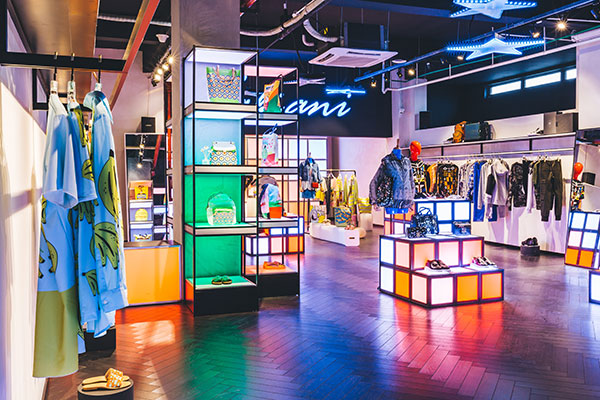
Exhibitions and Trade Shows
For exhibitions, the journey is about interest rather than entertainment. RFID wristbands show which booths attract attention, how long visitors stay, and which paths lead to higher engagement.
This data benefits both organizers and exhibitors, providing objective metrics beyond foot traffic estimates.
Events and Cashless Venues
At festivals and sports venues, RFID wristbands often serve as both access credentials and payment tools. Journey visualization combines movement data with transaction records, revealing how location influences spending behavior.
This insight helps optimize vendor placement and pricing strategies without intrusive surveillance.
Visualizing Group Behavior, Not Just Individuals
One common misconception is that RFID journey visualization focuses on individual tracking. In practice, its real value lies in aggregated insights.
Identifying Shared Patterns
When thousands of journeys are overlaid, patterns emerge. Certain paths become dominant, while others remain underused. These patterns reflect design choices, signage effectiveness, and visitor expectations.
Rather than asking why one person behaved a certain way, operators can ask why most visitors behave similarly.
Comparing Visitor Segments
RFID systems can associate wristbands with anonymous attributes such as ticket type, visit date, or time slot. This allows comparisons between segments without identifying individuals.
For example, morning visitors may follow different routes than afternoon visitors, or weekday guests may behave differently from weekend crowds.
Privacy, Anonymity, and Ethical Considerations
Visualizing customer journeys raises legitimate concerns about privacy. Successful deployments address these concerns from the beginning.
Anonymous Identifiers and Data Minimization
Most RFID wristband systems use random identifiers that are not linked to personal information. The system records movement patterns, not identities.
Data minimization is critical. Collecting only what is necessary reduces risk and builds trust with visitors.
Transparency and Communication
Clear communication matters. When visitors understand what data is collected and why, acceptance increases significantly. Many venues include brief explanations at ticket purchase or wristband issuance.
Ethical visualization focuses on improving experiences, not monitoring individuals.
Integrating RFID Journey Data with Other Systems
RFID wristbands rarely operate in isolation.
Linking with Ticketing and Access Control
When combined with ticketing systems, journey data gains context. Operators can see how different ticket types affect movement patterns and capacity usage.
This integration supports better demand forecasting and pricing strategies.
Supporting Operational Decision-Making
Journey visualization feeds into operational dashboards rather than marketing reports alone. Facilities teams, security, and guest services all benefit from understanding how people move in real time and over long periods.
Challenges in RFID-Based Journey Visualization
While powerful, RFID wristband systems are not plug-and-play solutions.
Reader Placement and Data Gaps
Poor reader placement can distort journeys. Missing reads may create false gaps or misleading paths. Careful testing and calibration are essential before relying on the data.
Interpreting Data Without Overreach
More data does not automatically mean better insights. Visualization should support clear questions rather than encourage over-analysis. Successful projects start with defined objectives and expand gradually.
Measuring ROI Beyond Traditional Metrics
The return on investment for RFID wristbands often appears indirect.
Experience Optimization as a Business Outcome
Reducing wait times, improving flow, and enhancing comfort lead to higher satisfaction, even if the impact is not immediately reflected in revenue reports.
Over time, improved experiences translate into repeat visits and positive word-of-mouth.
Operational Efficiency and Risk Reduction
Journey visualization also reduces operational risks. Understanding crowd density and movement improves safety planning and incident response, which has long-term financial value.
When RFID Wristbands Are the Right Choice
RFID wristbands are not suitable for every environment.
High-Traffic, Structured Spaces
They work best where movement follows semi-structured paths: parks, venues, campuses, and large facilities. In unstructured public spaces, the value diminishes.

Long-Term Insight, Not Short-Term Experiments
RFID journey visualization delivers the most value over time. Patterns emerge through repeated observation, making it a strategic tool rather than a short-term experiment.
The Future of Customer Journey Visualization with RFID
As expectations rise, physical experiences are increasingly judged by the same standards as digital ones. Visitors expect smooth flows, minimal friction, and personalized interactions.
RFID wristbands bridge the gap between physical presence and digital insight. By making customer journeys visible, they allow organizations to design spaces based on real behavior rather than assumptions.
In the coming years, the most successful deployments will not be those that collect the most data, but those that ask the right questions and use visualization to create better, more human-centered experiences.

